MRG, ENH: import code for optical imaging data from BOXY, fNIRS and fast signal #7717
Conversation
|
Hi @kylemath, Based on your comments above I took a look at [1] to understand more about the imagent device. The imagent seems to be a different class of devices to what MNE currently supports. Imagent is a frequency domain device, whereas NIRX, Hitachi, etc are continuous wave devices. (For those interested check out figure 1 in the referenced paper). Am I correct in this understanding? The advantage of frequency domain system should be that you can optionally measure tissue oxygen saturation using spatially resolved spectroscopy. However, this also means that you have additional data from the machine to store and process as you describe above, this includes additional data types and keeping track of modulation rates. So to be clear, this is not just about adding a new reader to MNE, it is about adding support for frequency domain near infrared imaging to MNE, adding a new reader, and adding the additional preprocessing steps for this data type. I have not used frequency domain devices before. Can you make a list of the additional processing steps that will be required in addition to those specified in this tutorial. Is it just heart rate removal and phase wrapping correction that you have mentioned above (if so, that shouldn't be too hard)? Or will modification to the existing NIRS preprocessing steps be required (e.g. Beer Lambert law)? Finally I will address some of your dot points from above...
At the moment the channel names must be in the form source number - detector number followed by the frequency of that channel. So an example is
I would recommend reading the file exactly as saved by the machine. In my experience, requiring people to modify the data before reading in to the software causes lots of issues due to human error or ambiguity in the instructions. If you do want to rename files, I would suggest following the BIDS format (BIDS for NIRS is under development, but you can view the existing BIDS spec to get an example of what it will become). [1] Scholkmann, Felix, Stefan Kleiser, Andreas Jaakko Metz, Raphael Zimmermann, Juan Mata Pavia, Ursula Wolf, and Martin Wolf. “A Review on Continuous Wave Functional Near-Infrared Spectroscopy and Imaging Instrumentation and Methodology.” NeuroImage 85 (January 2014): 6–27. https://doi.org/10.1016/j.neuroimage.2013.05.004. |
Yes instead of measuring continuous light it modulates the light at MHz and measures the modulated light at the detector, data files can save overall light, modulated light, and phase delay of the modulated light (to estimate how long it takes on average for photons to get from source to detector)
Perhaps, but not in the way we use it (I think you need a good estimate of tissue properties to do that well). Our system uses the phase delay signals as an estimate of faster scattering changes in the tissue. However, the processing pipeline for this phase signal will be identical to event related ERP analysis and the fNIRS visualization after the two preprocessing steps mentioned above, just with faster sampling rates.
Modulation rates are not important, the older machines which most people have only have one. The overall light (DC) signal is not used normally (as it includes ambient and task related light). The AC (modulated light) signal is identical to the continuous wave signal measured with continuous wave devices and for that AC channels, no further differences in the pipeline would be necessary after this import function. The Phase data would have slightly different pipelines as I mentioned before it could be treated like event related electrical data, but plotted on the topography like the fNIRS examples.
nope the only difference between continuous wave data AFTER the import will be the BOXY data has a faster sampling rate (for the phase data). The managing of the frequency modulated signals is already managed by boxy as it receives the data from the hardware (but finding the peaks of ffts). For the two extra steps in the phase delay signal (heart beat removal with regression, and phase unwrapping), i could build this into the import function so that there are not new methods needed in the subclass of Raw objects once created.
Sure things, working on that this week
Yes I believe so
Nope I think that is it, the wavelengths may be different, but it looks like _load_absorption can just look them up, my student and I are working through that tutorial on the AC data from BOXY this coming week and will push to this PR our progress
Yes our example in this PR already uses names like this, and then stores the grid location on the headgear somewhere else in info['chs']
Good idea |
|
Thanks for clarifying those points @kylemath, I appreciate you taking the time to inform me about frequency domain NIRS.
This is great news. This will be a lot less work than I imagined then.
The heart beat removal would be useful for continuous wave (CW) NIRS too. It might be good to keep that as a function that other data types can call too. The phase unwrapping seems quite specific to this data though. |
| @@ -0,0 +1,331 @@ | |||
| """ | |||
There was a problem hiding this comment.
no further differences in the pipeline would be necessary after this import function
If this is the case then we probably don't need another tutorial with an example pipeline.
However, if there are differences for processing frequency domain NIRS data then perhaps a frequency domain processing example would be appropriate that specifically highlights the differences between continuous and frequency domain analysis. I would try and keep it generic rather than tied to the specific ISS vendor format though (just looking at the filename).
There was a problem hiding this comment.
yes can rename or remove after, just using this as a testbed to see if my functions work
There was a problem hiding this comment.
and yes I will reduce the reliance on vendor specific naming once I have things working
|
getting closer, debugged enough for everything to run, locations kind of plotting: Dists calculate with the function but the data plots as completely flat, recreate with |

There was a problem hiding this comment.
Overall structure looks reasonable to me, seems like a good start! Left some minor comments, plus a major one that explains why your data are all zeros in the plot
I recommend using an editor with builtin flake8 capabilities because your file has a lot of red marks in my editor, and the CIs will complain at you :)
|
now to fix this alignment |

|
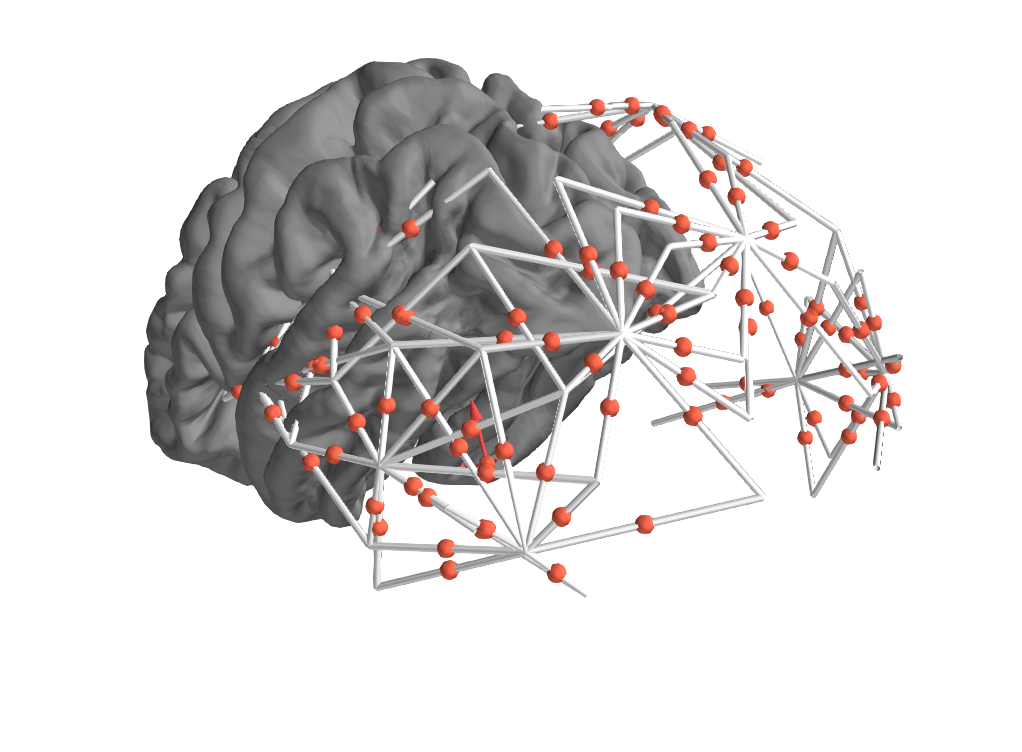
success, already transformed into fsaverage space, |

|
Looks like great progress! Let me know when you need feedback on anything |
|
I can't seem to get the .dig locations to show on the plot, the fiducials from the .dig do, but the other sensor locations do now. Does it matter if they are labeled as "extra" or as "EEG" locations? We labeled them as EEG for now:
info['dig'][0:5]info['chs'][0]['loc'] |

|
What actual kinds of points do you have? If it's just fNIRS channel locations, maybe you want to pass |
|
@larsoner The other confusion I have is back to the transformation of points PRIOR to making the raw structure in NIRx.py We were doing this to find transformation to fsaverage and applying it before creating dig: info = create_info(boxy_labels, srate, ch_types='fnirs_raw')
fid_path = op.join('mne', 'data', 'fsaverage', 'fsaverage-fiducials.fif')
fiducials = read_fiducials(fid_path)
trans = coregister_fiducials(info, fiducials[0], tol=0.02)
info.update(trans=trans)
###remake montage using the transformed coordinates###
all_coords_trans = apply_trans(trans,all_coords)
all_chan_dict_trans = dict(zip(all_labels,all_coords_trans))
fiducial_coords_trans = apply_trans(trans,fiducial_coords)
###make our montage###
montage_trans = make_dig_montage(ch_pos=all_chan_dict,coord_frame='head', nasion = fiducial_coords[0], lpa = fiducial_coords[1], rpa = fiducial_coords[2]) info.update(dig=montage_trans.dig)Which i found ment that when I plotted the alignment after I needed to specific trans=None: fig = mne.viz.plot_alignment(raw_intensity.info,
subject='fsaverage', trans=None, ...whereas the nirx.py example has fig = mne.viz.plot_alignment(raw_intensity.info,
subject='fsaverage', trans='fsaverage', ...So did we not apply the transformation correctly? Or should it be done differently such as: Currently instead I don't apply the transform during loading and just save the trans into info: info = create_info(boxy_labels,srate,ch_types='fnirs_raw')
info.update(dig=montage_orig.dig)
fid_path = op.join('mne', 'data', 'fsaverage', 'fsaverage-fiducials.fif')
fiducials = read_fiducials(fid_path)
trans = coregister_fiducials(info, fiducials[0], tol=0.02)
info.update(trans=trans)Then for plot_alignment, the following works fig = mne.viz.plot_alignment(raw_intensity.info,
subject='fsaverage', trans='raw_intensity.info['trans'], ...So, maybe this is related to my comment above about plotting the dig locations, and maybe I am doing something wrong during the coordinate creation and none of these is the correct way? |
We have plotted fnirs=['pairs', 'channels'] and that is working, as those are the channels in the info['chs']. However, we also have a set of locations for these and other points on the head (Extra). We digitize around the eyes, and all the other locations on the grid of helmet locations, to help with cooregistration. So we go through this file and pull out the location of the sources and detectors we use for the info['chs']['loc'] info, but there are additional points to plot as well that are only in ['dig'] |
This is already a no-no, https://mne.tools/dev/generated/mne.Info.html#mne.Info But the TL;DR is that if @rob-luke did not put it in, you probably don't need to / shouldn't :)
I would not mess with Where are your actual digitization points in your raw format?
This suggests that you have equated the Neuromag head coordinate frame and fsaverage's MRI coordinate frame (passing |
And our current naming matches SNIRF which I like. Thanks for the clarification. |
Co-authored-by: Robert Luke <[email protected]>
Co-authored-by: Robert Luke <[email protected]>
| @@ -11,22 +11,26 @@ | |||
| ref_meg='steelblue', misc='k', stim='k', resp='k', chpi='k', | |||
| exci='k', ias='k', syst='k', seeg='saddlebrown', dipole='k', | |||
| gof='k', bio='k', ecog='k', hbo='#AA3377', hbr='b', | |||
| fnirs_cw_amplitude='k', fnirs_od='k', csd='k'), | |||
| fnirs_cw_amplitude='k', fnirs_fd_ac_amplitude='k', | |||
There was a problem hiding this comment.
Would it be good to use different color for the different returned types? I am thinking that users will start by simply plotting their returned signals and want to see that three types were returned, maybe different colors would make it easier to see the different types and notice the different patterns in each type.
There was a problem hiding this comment.
yes sure, what other colours are available for phase and ac data?
There was a problem hiding this comment.
Is there a standard in the literature (similar to how HbO is always red and HbR blue?), otherwise something pleasing (anything but fluro green please ;) )
|
ok @rob-luke I updated the plot_30 text how does that look |
Perhaps 'DC data is analgous to continous wave amplitude measurements and so is stored as the type 'fnirs_cw_amplitude since ...` |
|
Ok I went through it all, only totally minor suggested changes. This is awesome that we now have frequency domain NIRS in MNE too. You'll have to add support for your type to all the other parts of MNE like topoplotting etc as you need them. But we did most of that already for CW NIRS. So if you raise an issue in advance we should be able to point you to the CW NIRS PRs, and the changes youll need to make should be near identical. Thanks for your patience explaining the CW/FD relationship to me. |
|
@kylemath @drammock @rob-luke I pushed 983200d to change to radians, fix the RST, and do a bit of rewording, see if you're happy with it: If so, @kylemath the only thing left I think is for you to pick better colors, for reference this is the doc I always use for inspiration: https://personal.sron.nl/~pault/data/colourschemes.pdf Once you choose the rest of us will try not to bikeshed the decision to death. 272 commits might already be a new record :) Also I've read that sometimes degrees are accepted as SI units, but radians are preferred. And we have a constant for radians and not degrees so I say we stick with radians, at least for our internal representation. In theory we can change this to degrees during plotting like I've mentioned before, but I somehow doubt it'll be worth it (the trends will still be clear, and I'm not sure people will really be able to interpret them anyway). |
|
hey @larsoner thanks for wrapping those up, I was just looking at our preprocessing code at what we do to the degrees after this The next steps are
I think these are preprocessing functions I will make, but thought I would bring it up since it doesn't matter if it degrees or radians in the end |
|
Ok i just went to change the colour and I don't think changing them makes sense, it is not often (i have never) that someone would plot more than one of these, they are normally analyzed separately. And so like all the other primary measures, ecog, meg, eeg, I think these should be black. @rob-luke ? @larsoner |
|
Excellent thanks for all the help and handholding, certainly the next one will be easier. great work @kuziekj |
|
Woohoo 🤖 |
Reference Issue
Continuing from discussion in #7057 regarding importing of other file formats of optical imaging data.
Issue #7718 introduced to discuss the goals and issues as well.
What does this implement/fix?
This creates io functionality for BOXY files created for the Imagent and Imagent 2 from ISS, which collect both overall and modulated light levels, but also phase delay measures used to measure fast scattering changes in neural tissue.
Additional information
Some important discussions to have regarding
data types (3 data types, overall light (DC), modulated light (AC), and phase delay (Ph), from each channel)
Wavelength
Modulation frequency - new imagent 2 machine has 4 modulation frequencies of light, which are used to measure AC and Ph in the measured signal, and may be relevant for light modeling and analysis
Channel names - are based on a letter/number grid on our headgear, but need to be flexible
digitization and coregistration - common head, individual heads, fiducial alignment, other head points, sensor locations/midpoints
markers from data files
importing multiple files per participant (old systems use on file for each detector), all files use one file for each montage (arrangement of sources and detectors), usually collected in separate sessions, for both these cases only a single digitization file is needed, but different files of source and detector locations used.
renaming files - BOXY outputs time stamped files, and usually matlab script is used to rename files by subject number, experiment, etc., build into this?
preprocessing functions - heart beat removal - regression based heart beat removal for fast signal needed as pulse wave spectra overlaps with fast signals (Corballis and Gratton) (ppod software - https://code.google.com/archive/p/p-pod/)
preprocessing functions - phase wrapping correction - phase signal is modified to a continuous signal (ppod software - https://code.google.com/archive/p/p-pod/)
References:
boxy optical imaging workflow:
http://sites.psych.ualberta.ca/kylemathewson/optical-imaging/