![]()
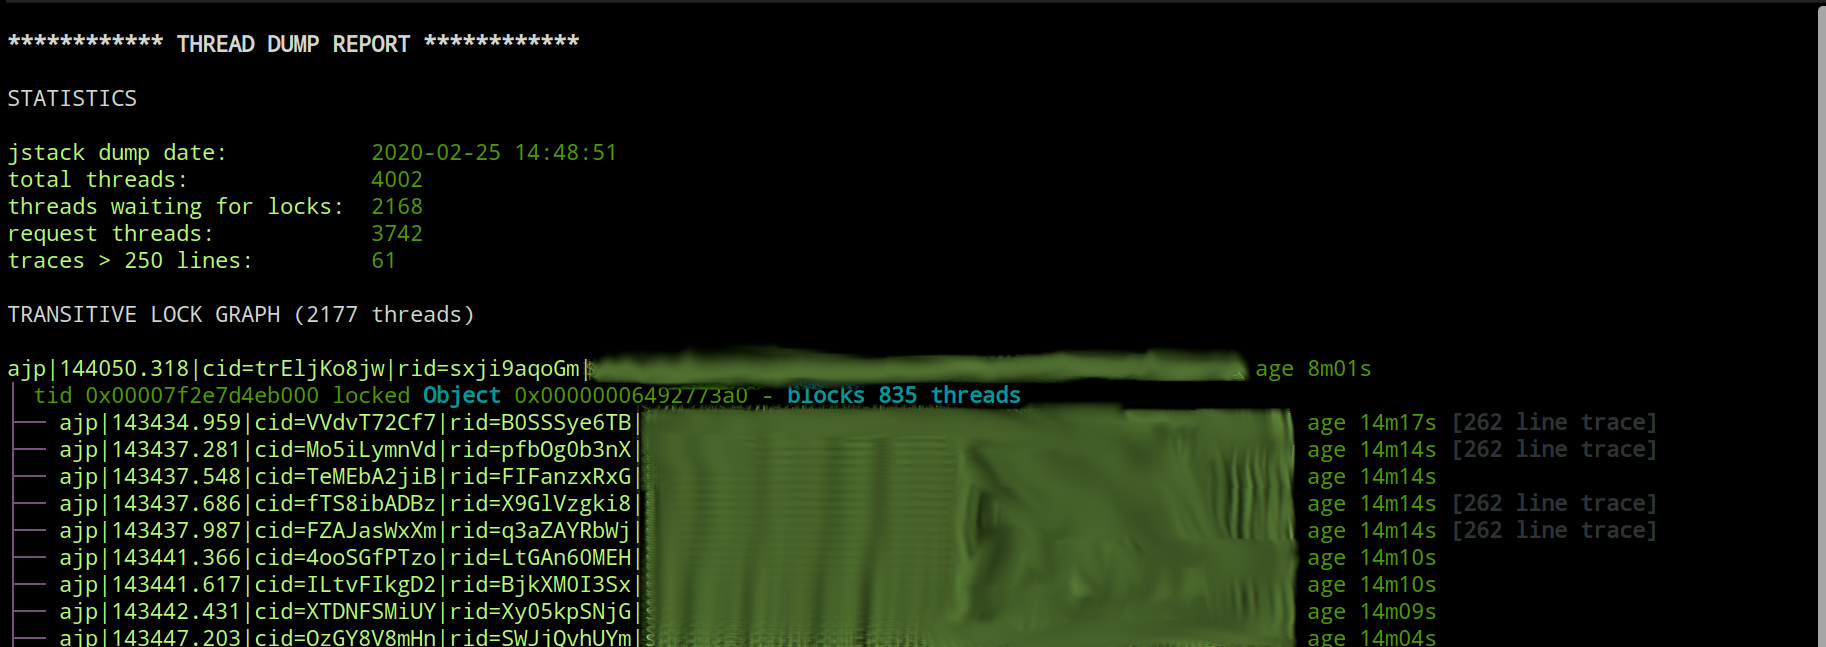
jstack-report - a tool for visualizing the transitive lock graph of a java thread dump
In long running server side java processes you sometimes end up with either a fully broken JVM or a JVM which slowly crawls to a stop as more requests come in and old ones fail to be processed in a timely fashion. This can typically happen in complex enterprise applications with a lot of network/file access and wich are glued together from a large number of libraries and dependencies. This can also happen for various reasons in simpler situations, but I've personally typically seen this behaviour in complex enterprise settings.
So at this point you are usually left in a hurry and scracthing your head. You have a limited number of things you can do to try to introspect the broken JVM. One of the most obvious and powerful moves is to take a thread dump of the java process using the jstack tool provided with the JVM.
This sounds all fun a dandy until you realize the thread dump text file you just generate is half a million lines long and represents 4000+ threads, most of which are waiting to lock something. When I say lock in this context, I am talking about the java thread synchronization mechanisms of synchronized and Lock.lock.
In a large thread dump the interconnected locking behavior of the threads generate a directed acyclic graph of lock requests waiting to be fulfilled. To trace this graph manually to the root cause which is holding everything up can be close to impossible and if nothing else time consuming manually. Usually more time consuming than what project timelines and pointy haired bosses are willing to allocate for troubleshooting "some random hangup".
A an example, lets assume we have a java server process and the following flow occurs:
- a client request on thread A comes in to the server, it locks resource APPLE and then starts waiting to lock resource ORANGE which is already locked by someone. Thread A is now left waiting to lock resource ORANGE until the lock is released by whoever is holding it...and it retains the lock on APPLE until it can get its work done.
- a client request on thread B comes in to the server, it locks resource BANANA and then tries to lock resource APPLE. APPLE is already locked which leaves thread B waiting to lock it.
- a client request on thread C comes in to the server and tries to lock resource BANANA...
As you can see from this simple example this quickly gets very complex. In this parcilar example we have four threads and it is already getting hard to keep track of who is holding what and what the root cause of the cascading issue is (ORANGE being locked indefinitely and thread X not completing its job for some reason).
If we were to draw this acyclic graph using ascii graphics, we might come out with something like this:
TRANSITIVE LOCK GRAPH (4 threads)
thread X
| tid 0x00007f2e7d4eb000 locked ORANGE 0x00000006492773a0 - blocks 3 threads
└── thread A
│ tid 0x00007f2e7d4eb000 locked APPLE 0x00000006492773a0 - blocks 2 threads
└── thread B
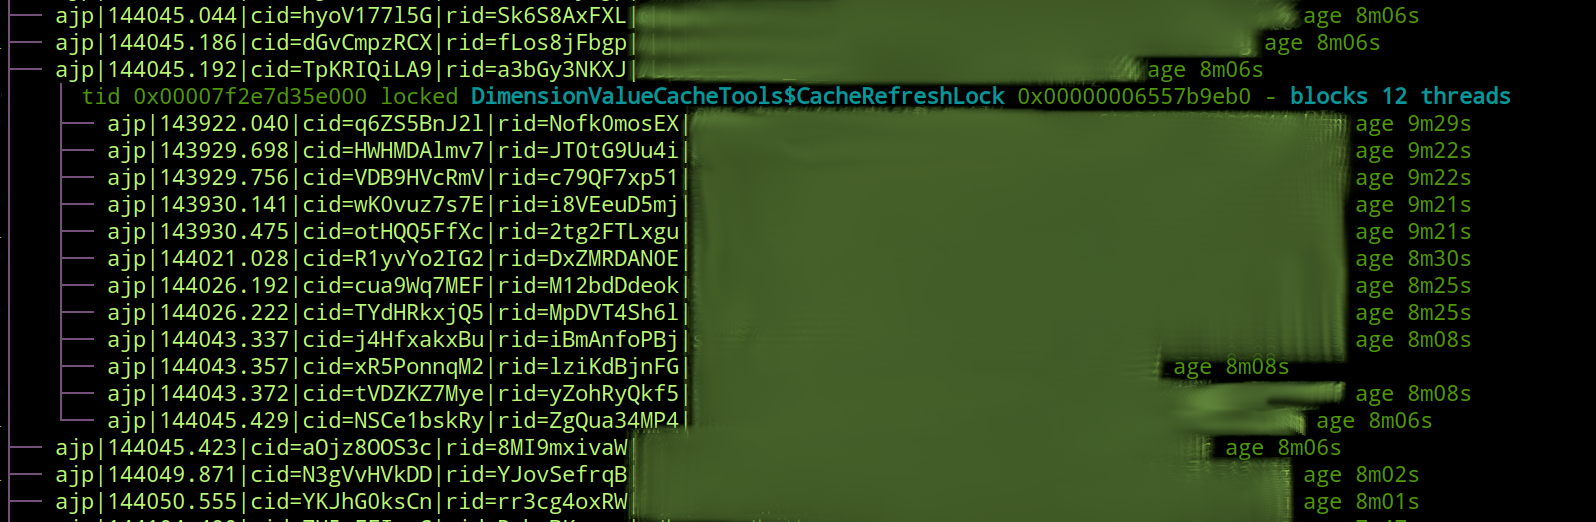
│ tid 0x00007f2e7d35e000 locked BANANA 0x00000006557b9eb0 - blocks 1 threads
└── thread C
It should be noted here that what we get in the thread dump generated by jstack is not something nicely formatted like this. We get a number of (probably long) stack traces for the threads and interleaved somewhere in there are lines like:
  - locked <0x00000007d39893e0> (a org.jboss.TransactionReaperMutex)
  - waiting to lock <0x00000006492773a0> (a java.lang.Object)
where for each of the object ids in question, you would need to find the thread that locked that object id, make a mental model of how that graph looks and proceed to the next level.
At this point I think a lot of people just restart the VM and whistle their way home hoping this abhorrent evil alignment of the planets just never happens again. Fingers crossed.
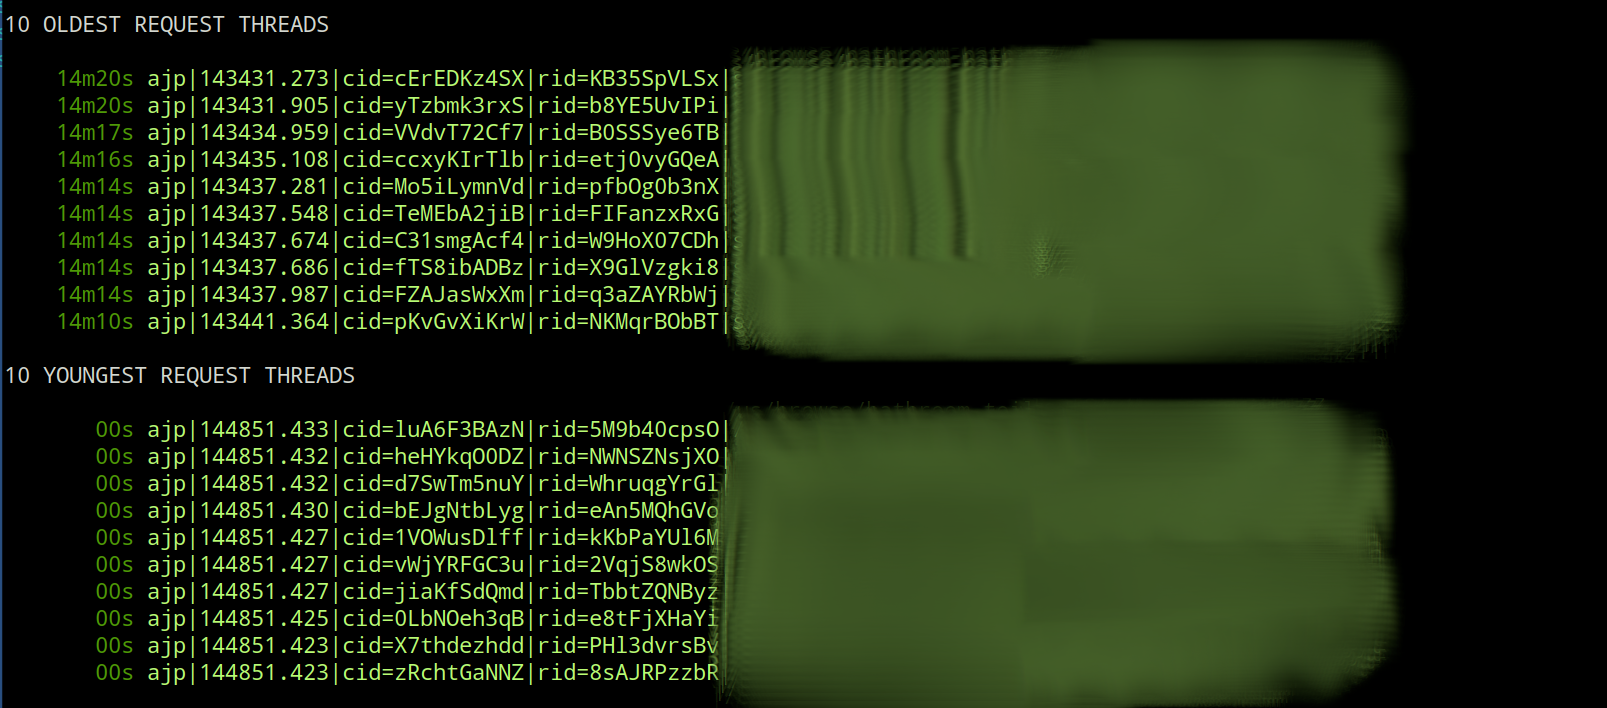
This tool was custom written for a specific scenario and implementation. This means that it can parse generic jstack thread dumps but will lose a number of the decorations built for the specific case it was created for. Specifically, the thread names in the case the tool was built for had been customized to contain some relevant information and the output is therefore somewhat richer for the original case than for a generic thread dump.
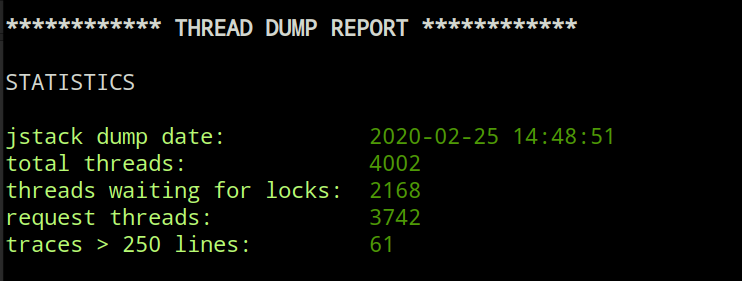
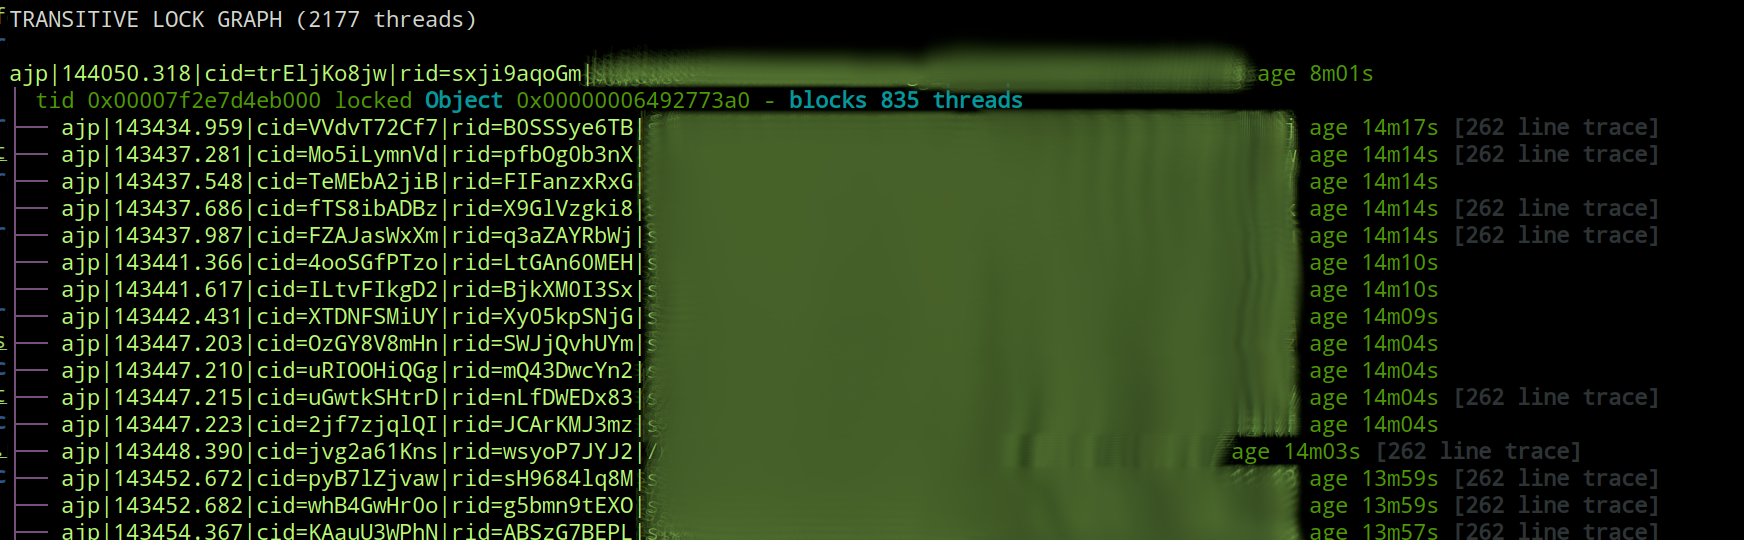
It should be noted that even without the specific thread naming mentioned above, the tool will display the summary section and the transitive graph which is the most important part of the report.
As mentioned above, the tool will work for a generic thread dump, but if the threads in the dump are using a specific naming convention, the report will contain additional information.
Specifically, the thread naming convetion this tool was implemented against is:
<ajp|http>|<thread start time>|cid=<client id>|rid=<request id>|<requested url>
where:
- ajp or http. Stands for the connector threads between apache and jboss - yes, the tool was used to troubleshoot a jboss implementation.
- thread start time is a time stamp on the format HHmmss.SSS - note there is no date information here so the tool is forced to run under the assumtion that a thread is less than 24 hours old.
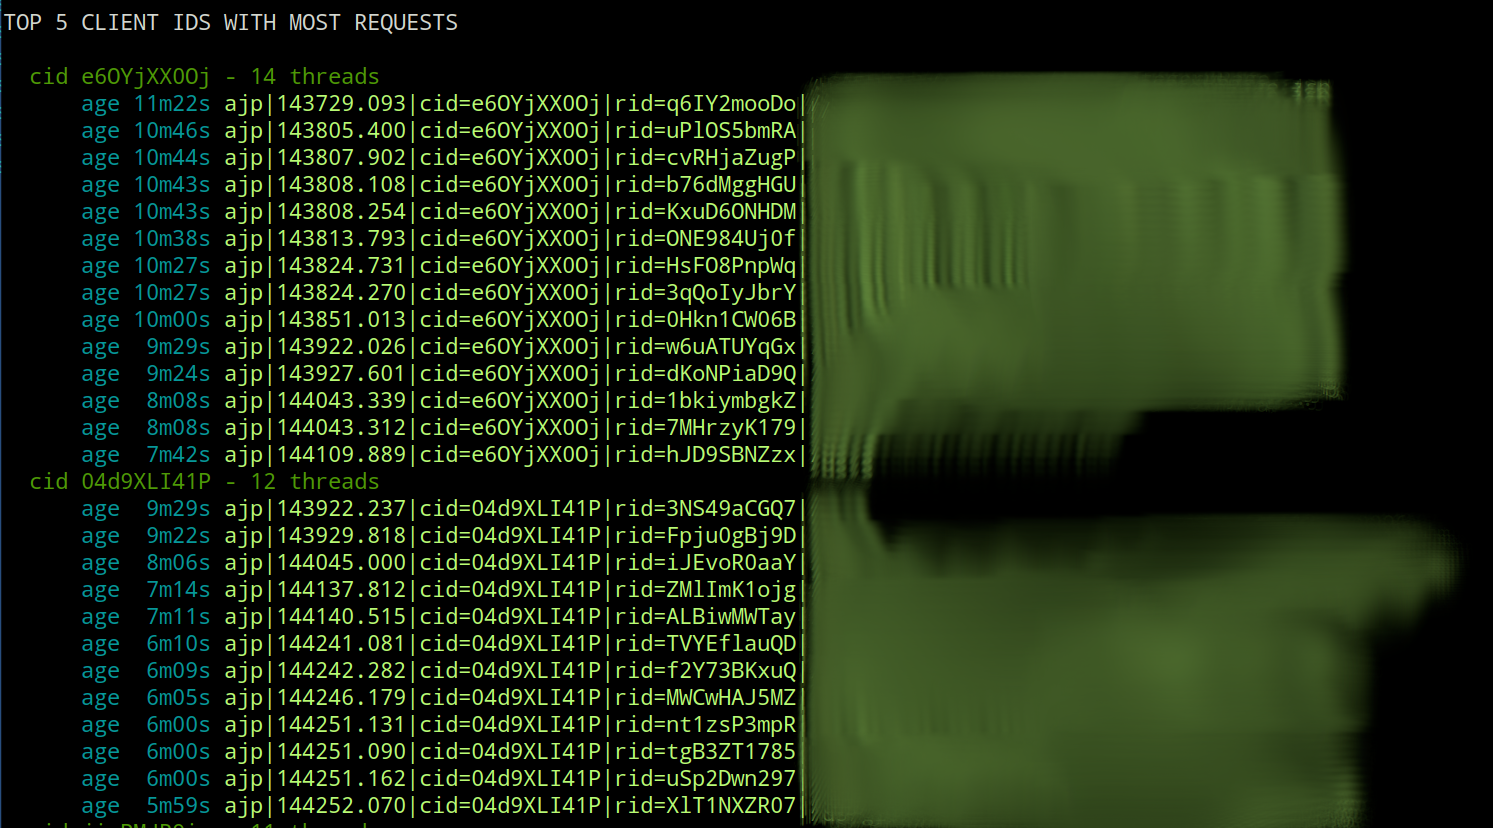
- client id is a unique id generated for each calling client. This id is sent to the requesting client as a cookie and is thus retained across requests.
- request id is a unique id generated per each request.
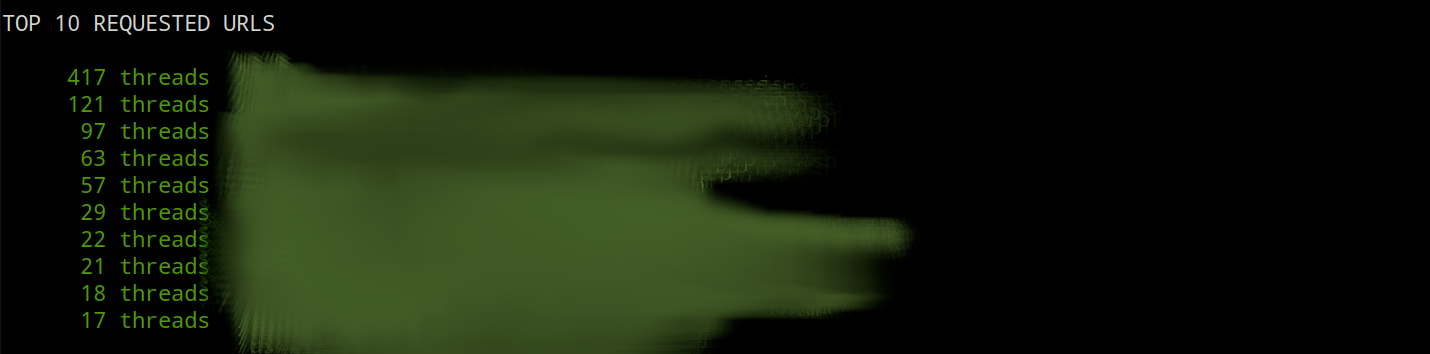
- requested url - what it sounds like. These are in general blurred in this README to hide real world url patterns.
In other words, the application has installed a custom thread factory on the JVM which names all threads according to this pattern which in turn makes it possible to tie threads to the calling client, a specific request, or a specific url. Standard operating procedure, but quite useful.
All or a subset of these could quite easily be customized to fit some other naming convention...and if I feel ambitious at some point and have some time to spare, I might implement some kind of pattern language or protocol for defining these things externally...though don't hold your breath on that one.
This project uses:
- java - tested against java 11, 17, and 21.
- clojure - clojure installation instructions can be found here
- leiningen - leiningen installation instructions can be found here
Assuming the above requirements of java, clojure and leiningen are met, you can build the project using:
 ─➤ lein clean
 ─➤ lein uberjar
which will generate an uber/fat jar in the target directory after which you can run the tool as described in the section below.
Once you have the jar file available you can execute the tool using something like the below:
─➤ java -jar target/target/jstack-report-1.0.0-standalone.jar -f <some-dump-file>
If you are on osx or *nix and you want to make life easier you can create an alias:
─➤ alias jstack-report="$JAVA_HOME/bin/java -jar ~/jstack-report/target/jstack-report-1.0.0-standalone.jar $@"
(replacing ~/jstack-report with wherever your jar file is and replacing JAVA_HOME with a valid java installation path if you don't have JAVA_HOME set).
After this you can run the tool as you would a normal command:
─➤ jstack-report -f <some-dump-file>
─➤ java -jar target/jstack-report-1.0.0-standalone.jar

jstack-report - a tool to analyze lock chains in jvm thread dumps

usage: java -jar jstack-report-1.0.0.jar -f <jstack-thread-dump-file>

or

usage: cat thread_dump.txt | java -jar jstack-report-1.0.0.jar

Defaults to reading from stdin, i.e. the second usage example
above.

Options:
  -f, --file <jstack dump file>  A thread dump file as produced by jstack
  -n, --no-color                 Disables ansi coloring of output
  -h, --help


Author: Matias Bjarland / [email protected]

jstack-report 1.0.0 - 66537ea - 2023.09.29 16:03:01 +

no thread dump provided - doing nothing!
The project is released under the Eclipse Public License - v2.0
Matias Bjarland / [email protected]