This project uses the network shape and locations of a GTFS dataset to calculate distances to common used facilities over roadnetwork and public transport network. The toolset used in this project is still in an experimental phase. Many of to codebase should be optimized for different systems, some code should still be generalized to functions. The project uses several python libraries, but also QGIS and Arcgis Pro (both required).
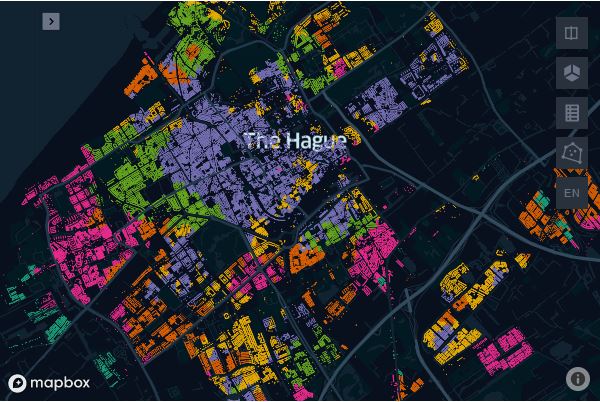
This collection of notebooks can be used to cluster houses, and thus generate multiple K-means clusters. All of these K-means clusters, show similair levels of Accessibility. For example Cluster one has an average distance of 300 meters to the closest supermarket, and 500 meters to the closest Supermarket.
The results can be viewed by accessing this link: Click Here
A preview:
The toolset uses the functions from the QGIS QNEAT3 plugin to calculate the OD-matrices in long format. One can implement these function into a python project, this was not done for this project untill today. This project used QNEAT3 in QGIS manually. A link to QNEAT3: Click Here
Besides QGIS, the project also uses a buildin algorithm from Arcgis Pro. Arcgis Pro contains an algorithm to transform the shapes that a GTFS dataset contains, to an ESRI shapefile. You will need this ESRI shapefile in the analysis/python scripts.
The python packeges used can be found in the requirements.txt file. Important libraries are geopandas, pandas, scikitlearn and their dependencies. For visualisation kepler.gl is used.
- Data.
Start be retrieving the required data. In order to run this project, one needs at least a GTFSdataset and dataset from openstreetmap. You can retrieve your GTFS dataset from google, use this link: Click Here
You can retrieve your openstreetmap data (for your area of analysis) Click Here
If you want to run my code, you also need a small dataset from CBS. Click Here This dataset is only used to clip the openstreetmap data.
- Preprocessing GTFS
In order to start the preprocessing process, you will need the 'GTFS5.ipynb' jupyter notebook. This notebook makes sure that you can extract the data you would like to analyse. In this project, the service network of HTM (a public transport carrier) was analyzed. This script makes sure than only the stops of HTM will be analysed, and not all stops and shapes in the GTFS dataset. This notebook was used to create two datasets: shapes.txt and stops.txt for HTM. Shapes.txt was converted to an ESRI shapefile, using the Arcgis PRO GTFS toolset. Stops.txt can be loaded into Qgis directly.
- Clipping open street map data
In this step you'll need the data of open streetmap. If you want to use the points of interests dataset as destinations, you should use the multipoint to point script (Multipoint to Point.ipynb). This makes the open streetmap data suitable for the Qneat3 algorithm you'll need in further steps. As origins, we will use the polygon houses dataset of openstreetmap. Now you'll need the 'Filter to the Hague.ipynb' notebook. This notebook will calculate the centroids of all buildings in the selected area (which is why I used the CBS dataset), after that it will cluster all obtained points with the Kmeans algorithm on the longtitude and lattitude attributes. This makes sure we will be able to reduce the size of the dataset. Once all is clustered, we use the houses closest to the centres of the clusters. These are the houses we will use to calculate the distances. You will also need to clip the roadnetwork to the area of analysis.
- Calculating OD-matrices
In this step you''ll need Qgis with the Qneat3 plugin, we will use this algorithm to calculate distances. You will need to calculate a number of OD-matrices.
Firstly, determine an origin destination matrix between all stops (stops.txt) using the converted shapes.txt file. Shapes.txt will be your networkdataset.
Secondly, calculate all distances between all clustered houses (see step 3) to all stops over the road network that you obtained from open street map. The notebook 'OD-matrix after Kmeans.ipynb' is used to determine the closest house per stop.
Thirdly, calculate matrices between all stops and all points of interests you want to analyse (Use Multipoint to Point.ipynb to make sure that QNEAT3 will accept your data). In my case I used two Scripts to determine the distances over the road as well as the public transport network to the closest points of interests. For the supermarkets I used OD-matrix stops-Supermarkets1.ipynb and for the other facilities I used facilites.ipynb
- Detecting outliers in Qneat3 output.
In this repository, an outlier detection script for Qneat3 is included as well. It compares the minimum distance with the maximum distance from the same origin. In case the Qneat3 algorithm fails (Which might be fixed by the time you're reading this), this script will help you to extract the errors.
- Clustering accesibility
Using the 'Kmeans elbow 2.ipynb' script, the houses were clustered based on the calculated distances calculated in step 4. This script was also used to generate some histograms, the elbow plot for determining K, and some descriptive statistics. The script 'Generalize_Results_To_All houses.ipynb' was used to generalize the results to all houses in The Hague.
- Displaying results
Use the kepler.gl library to make a nice visualisation of your results. A link to this library is provided here